Justice System Case Flow


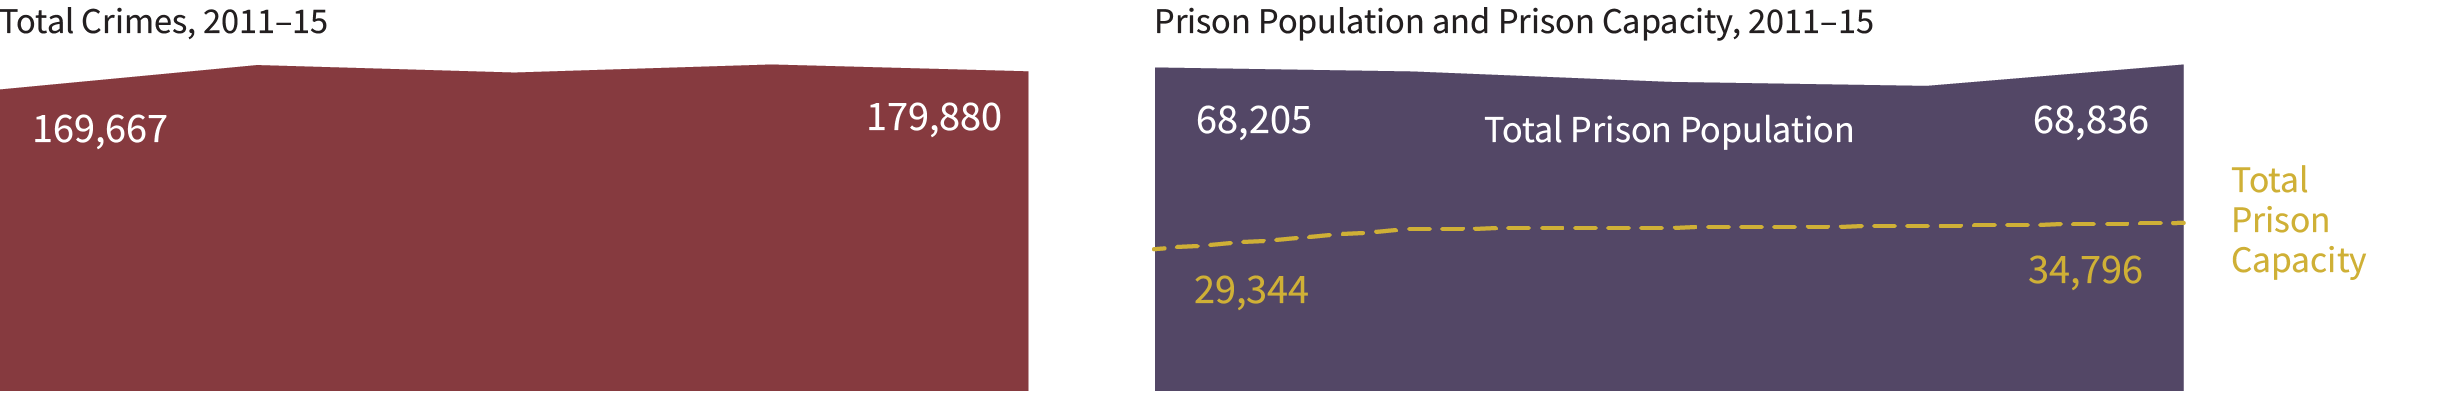
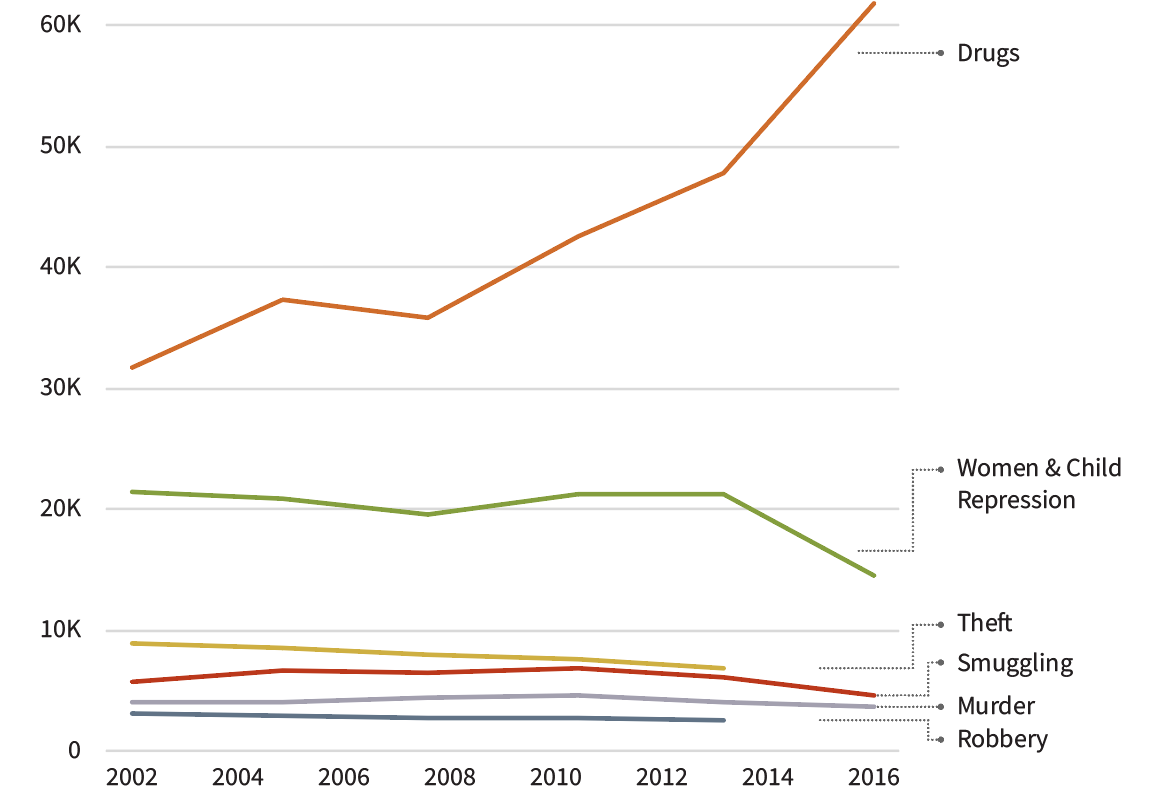
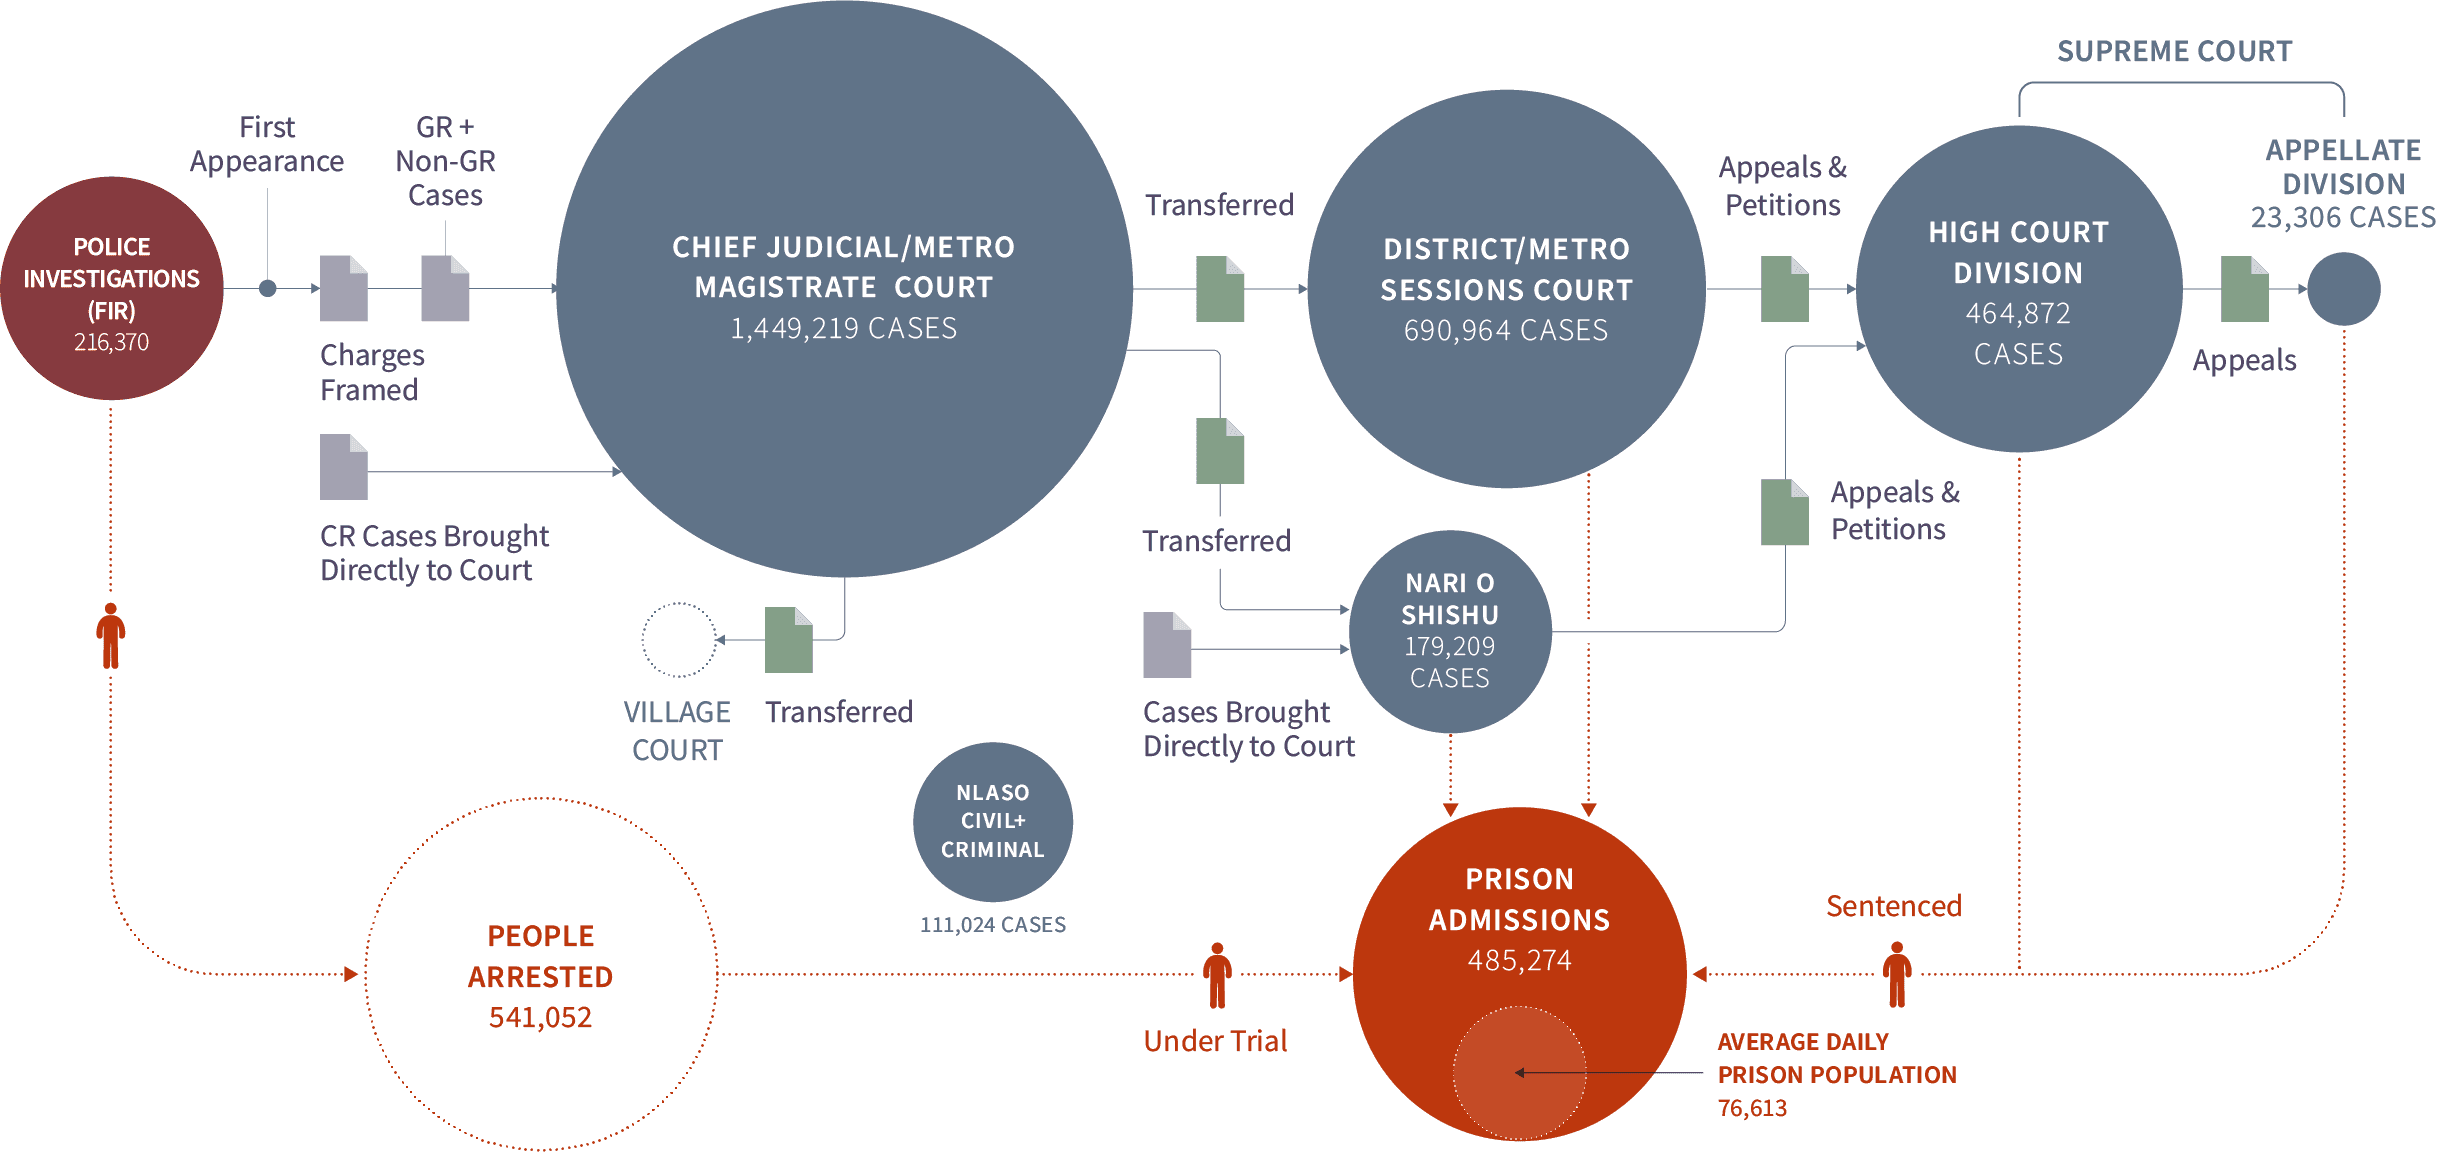
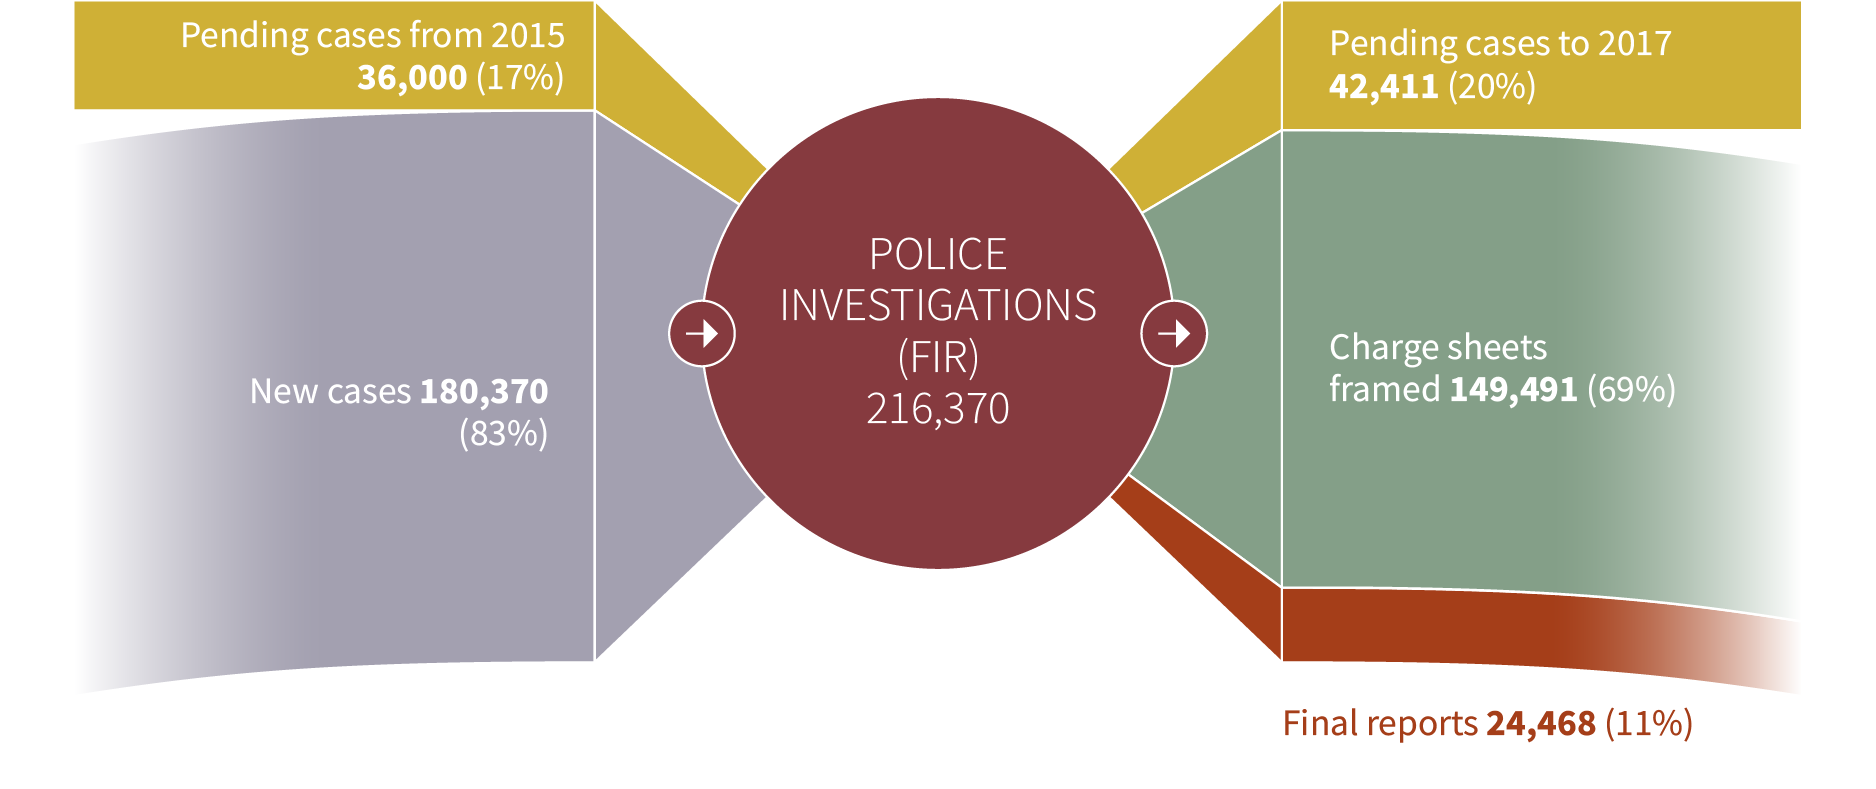
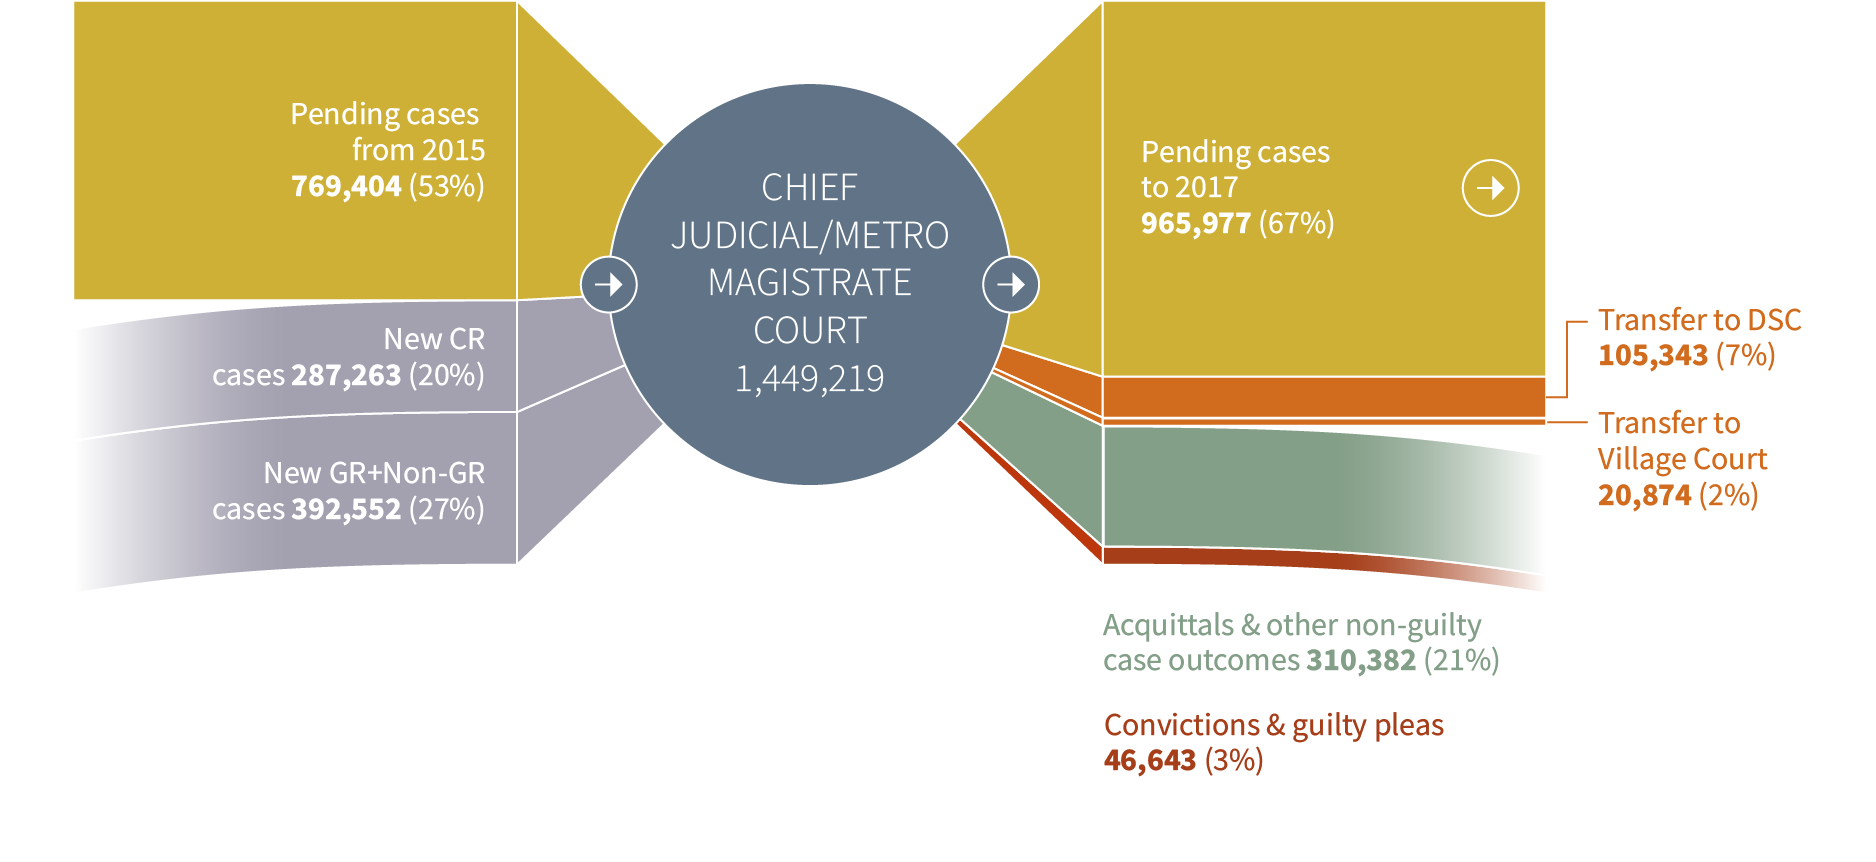
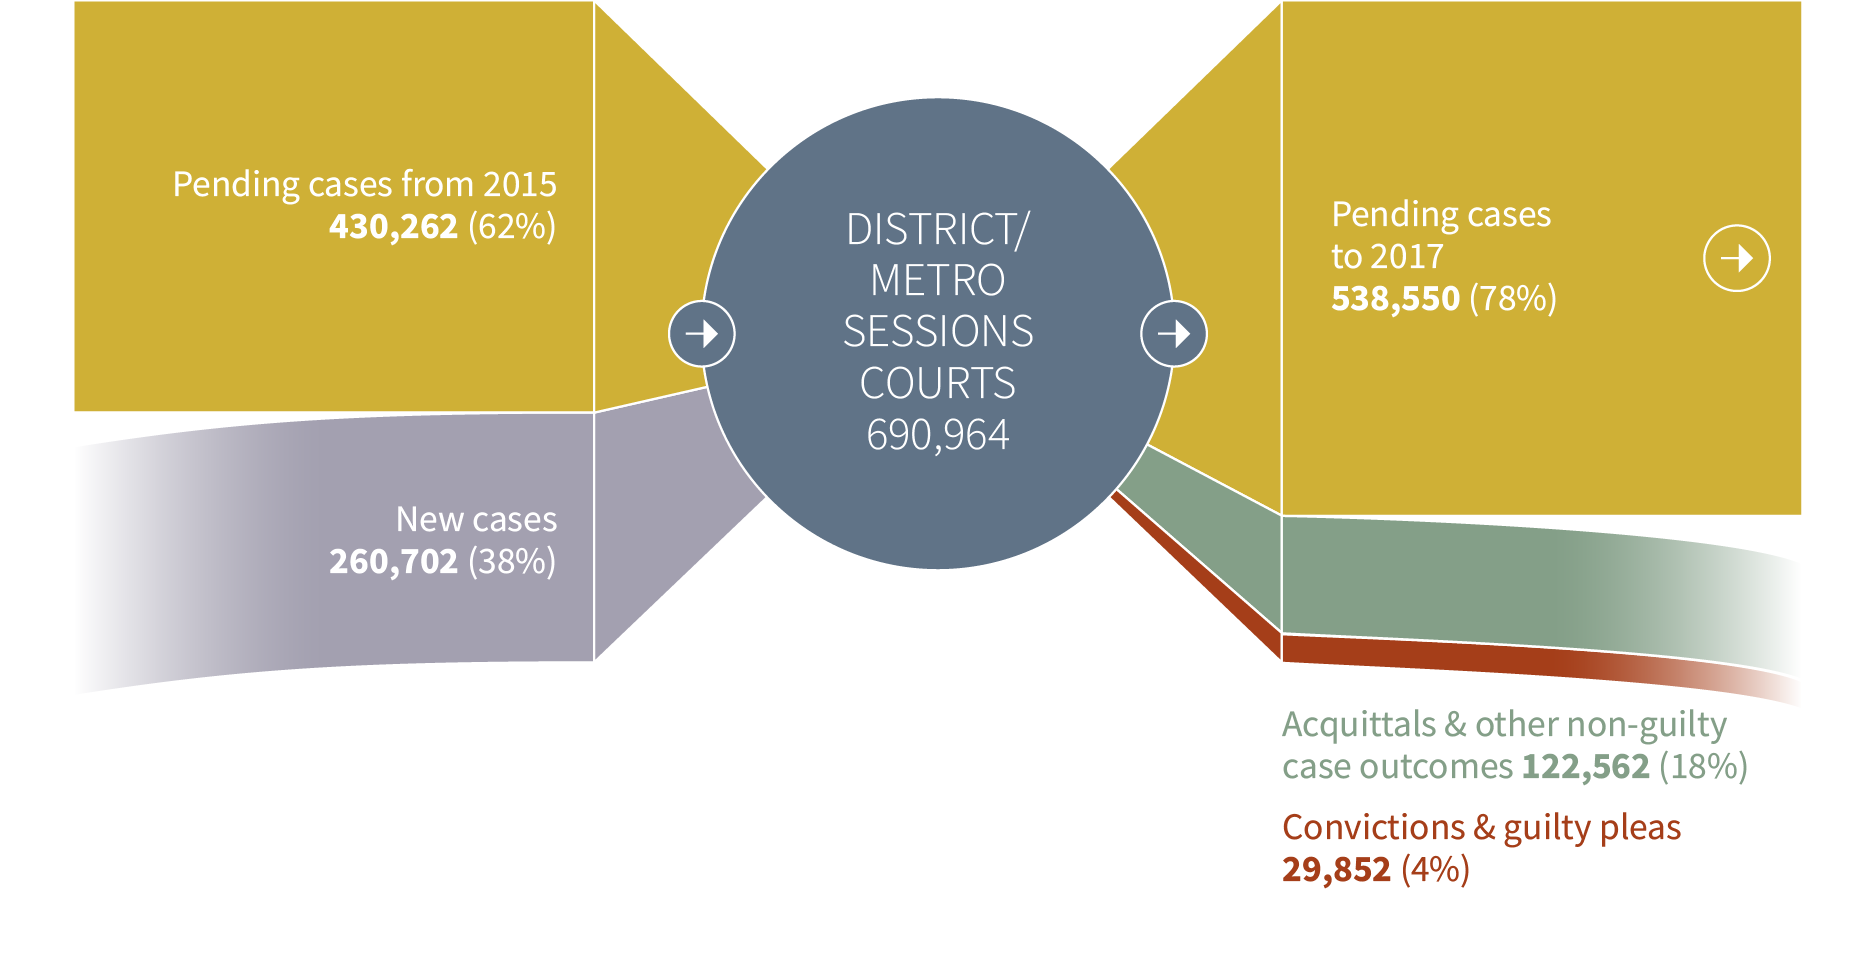
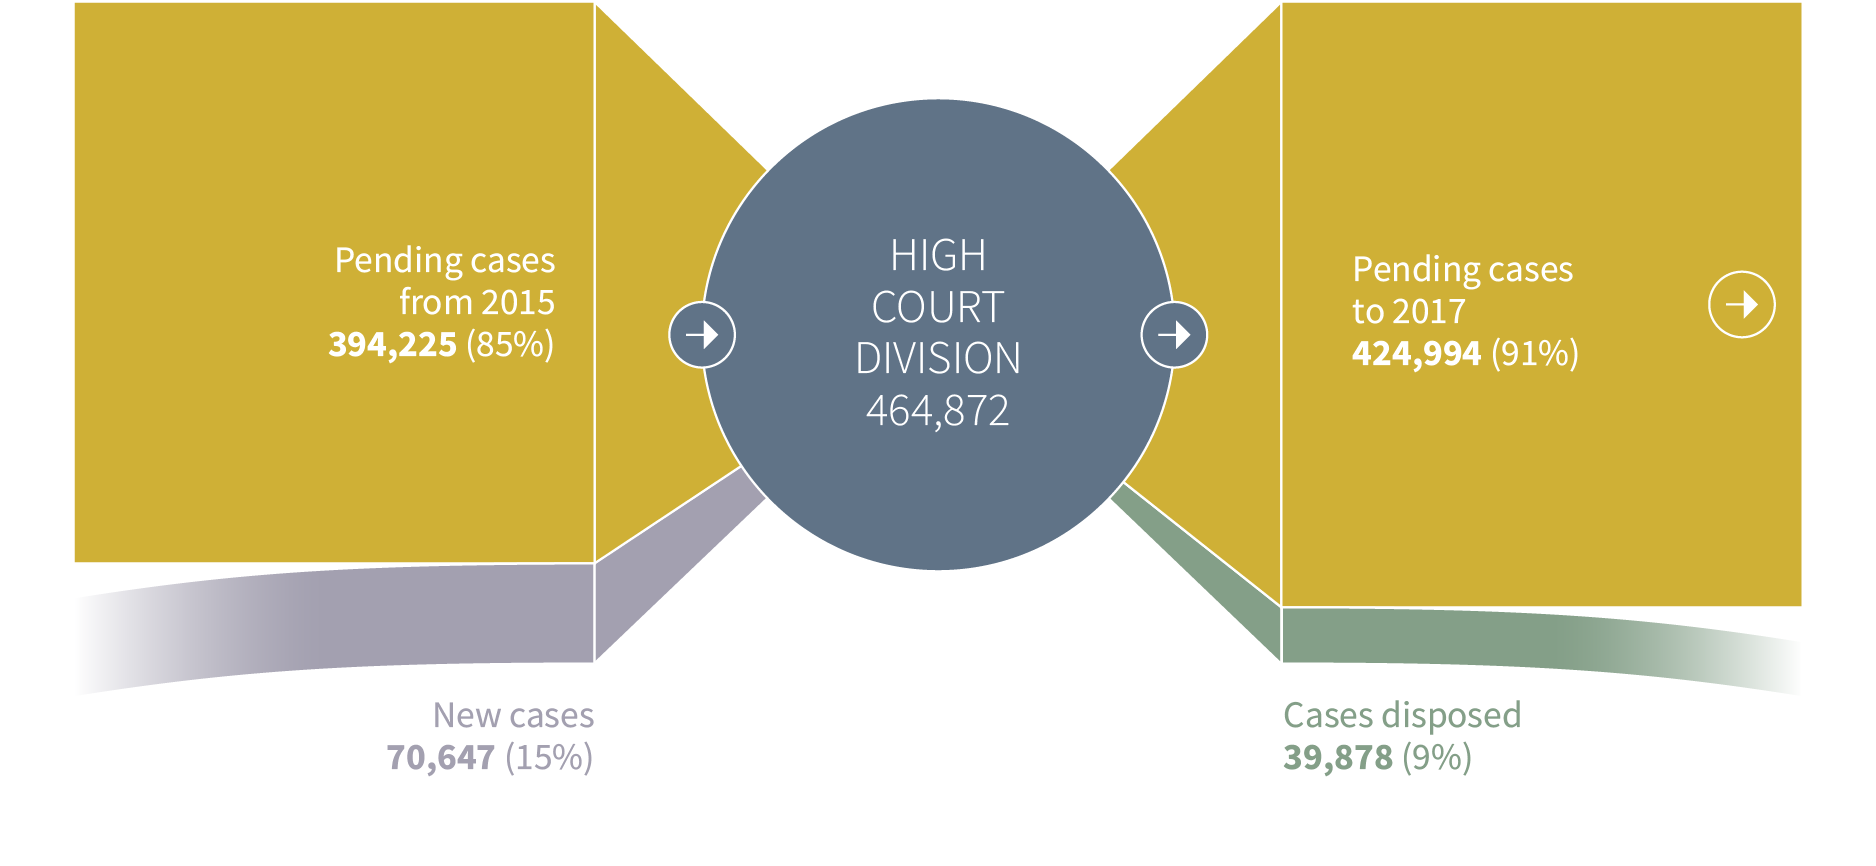
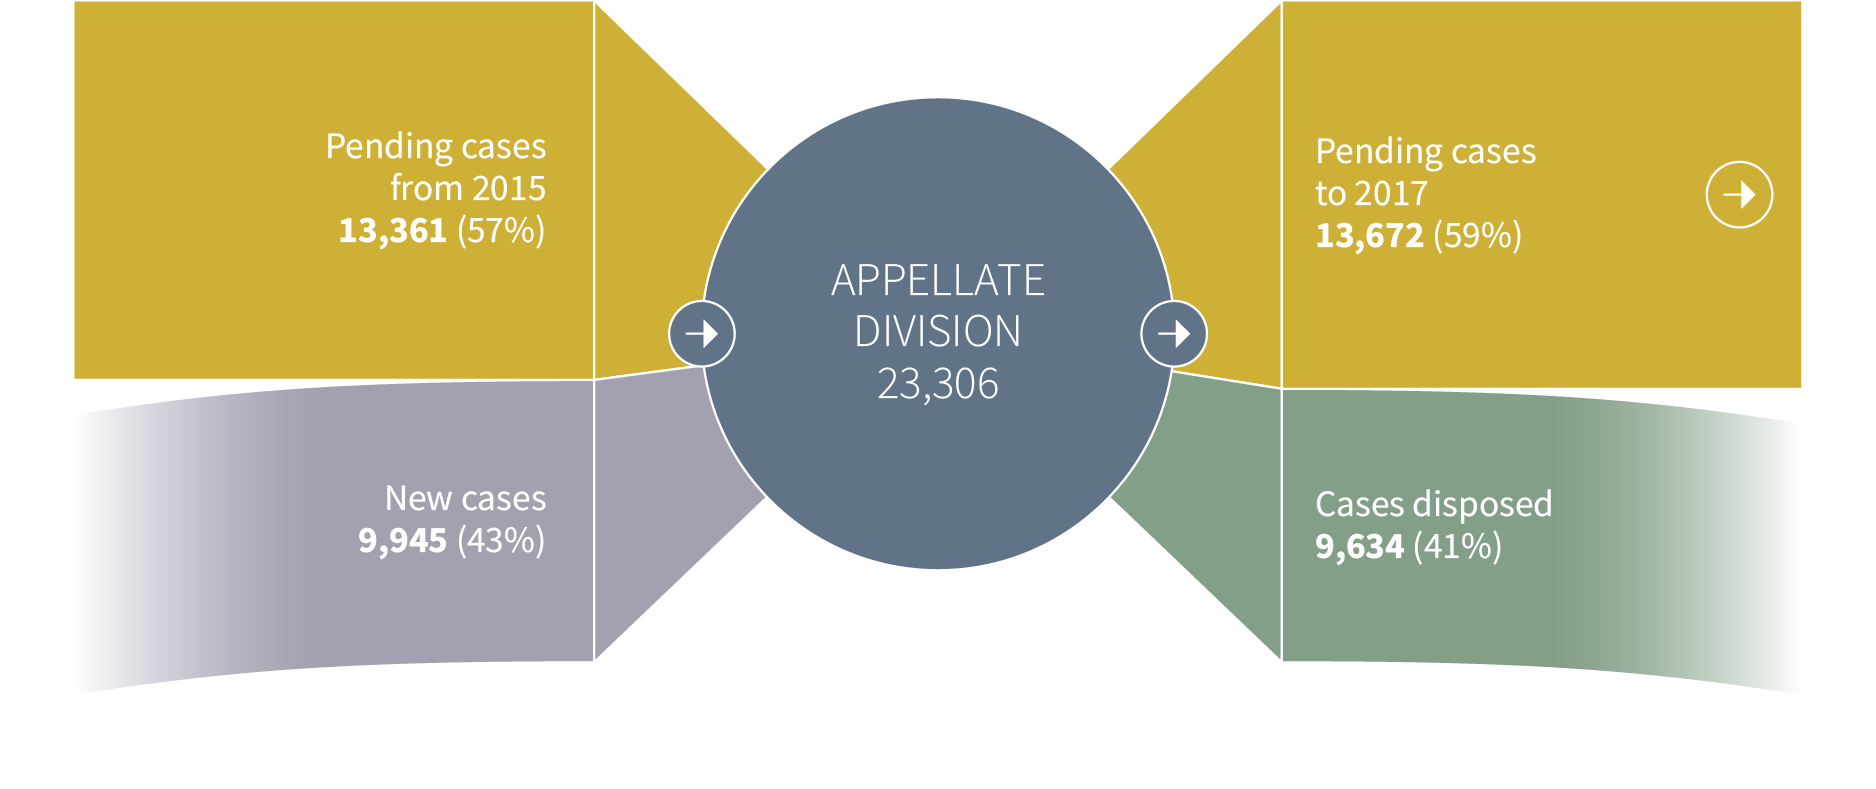
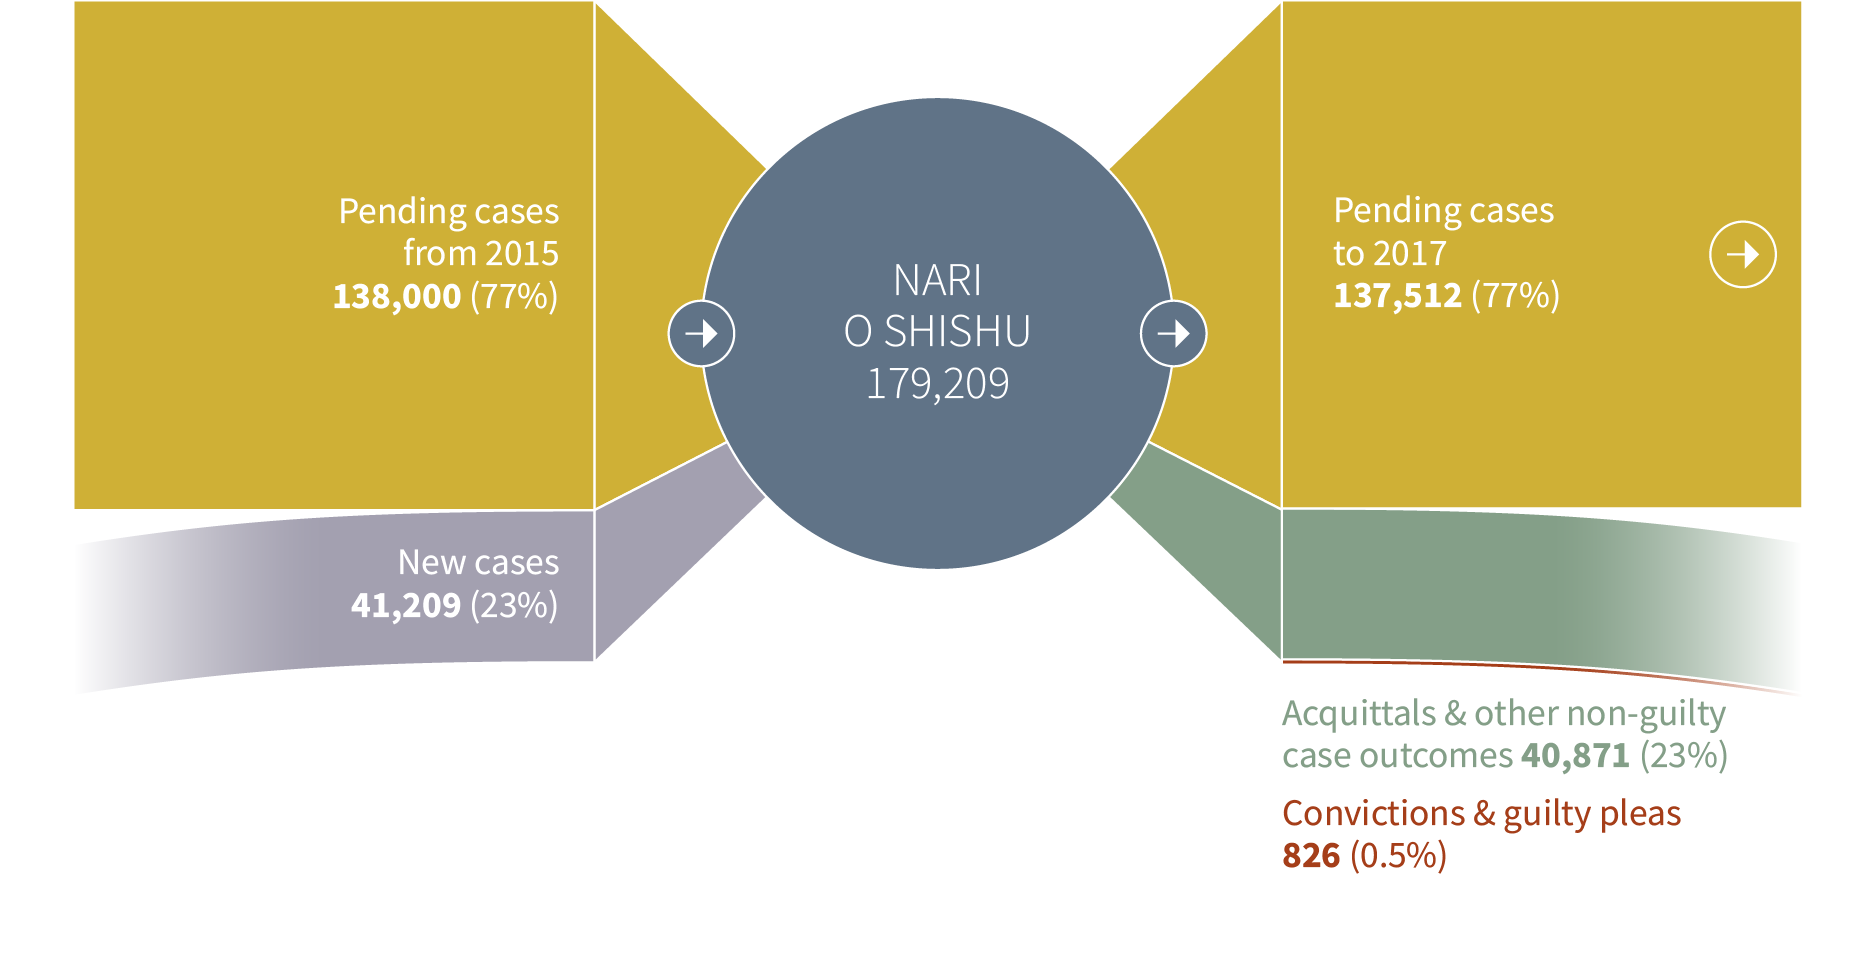
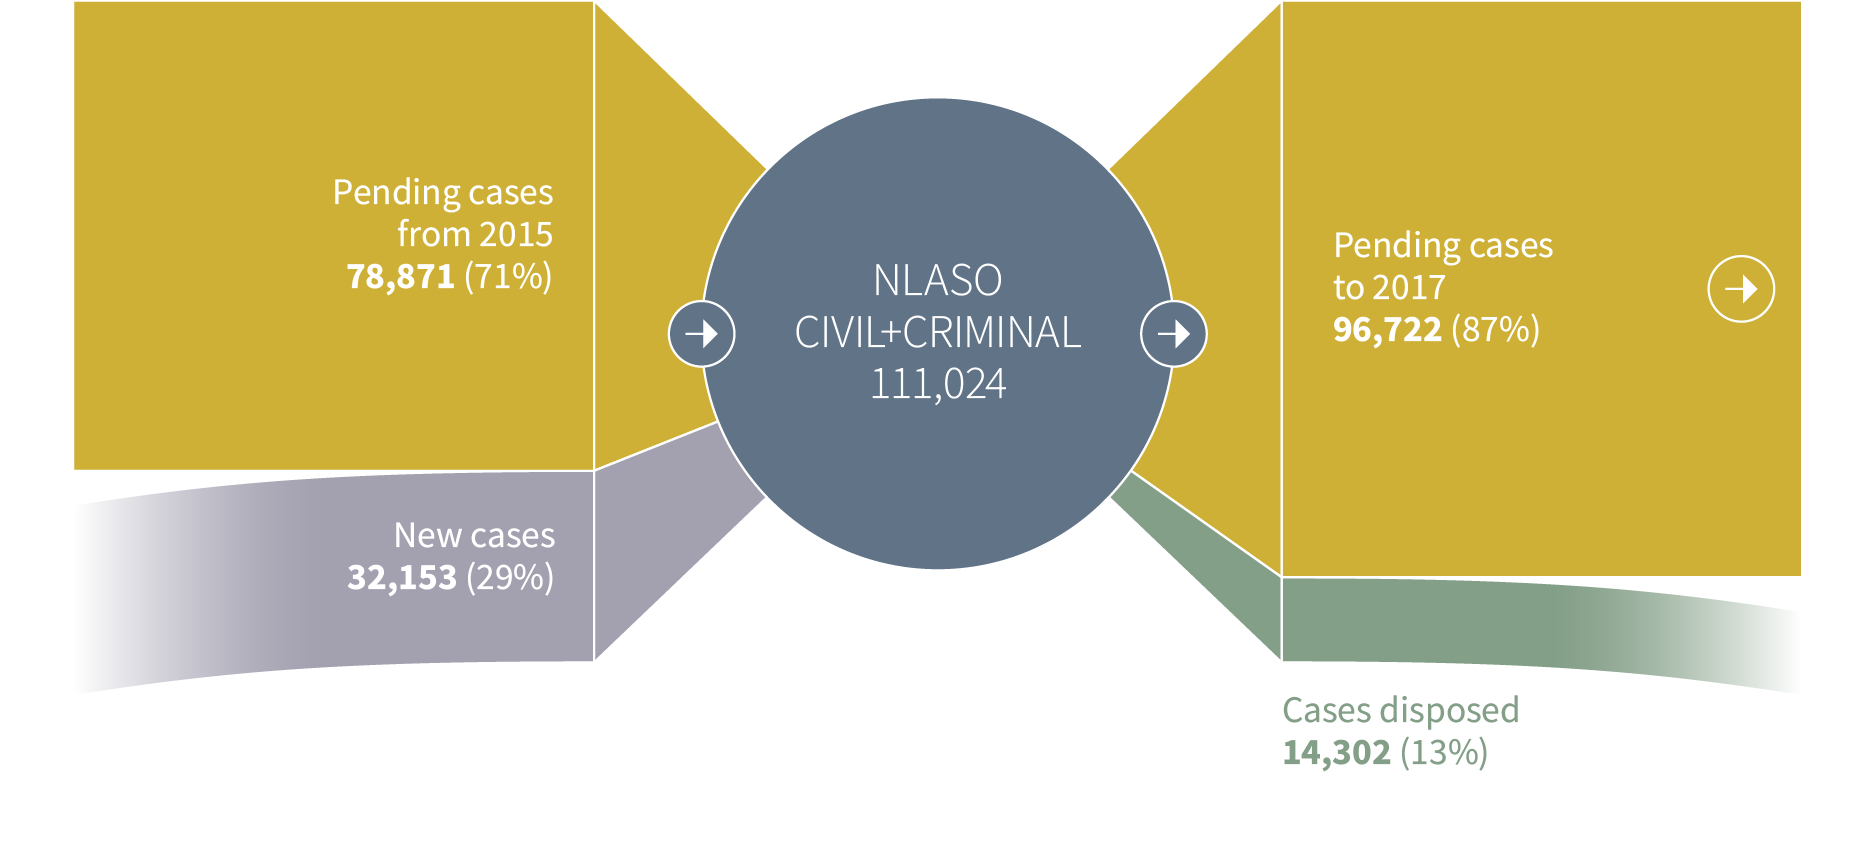
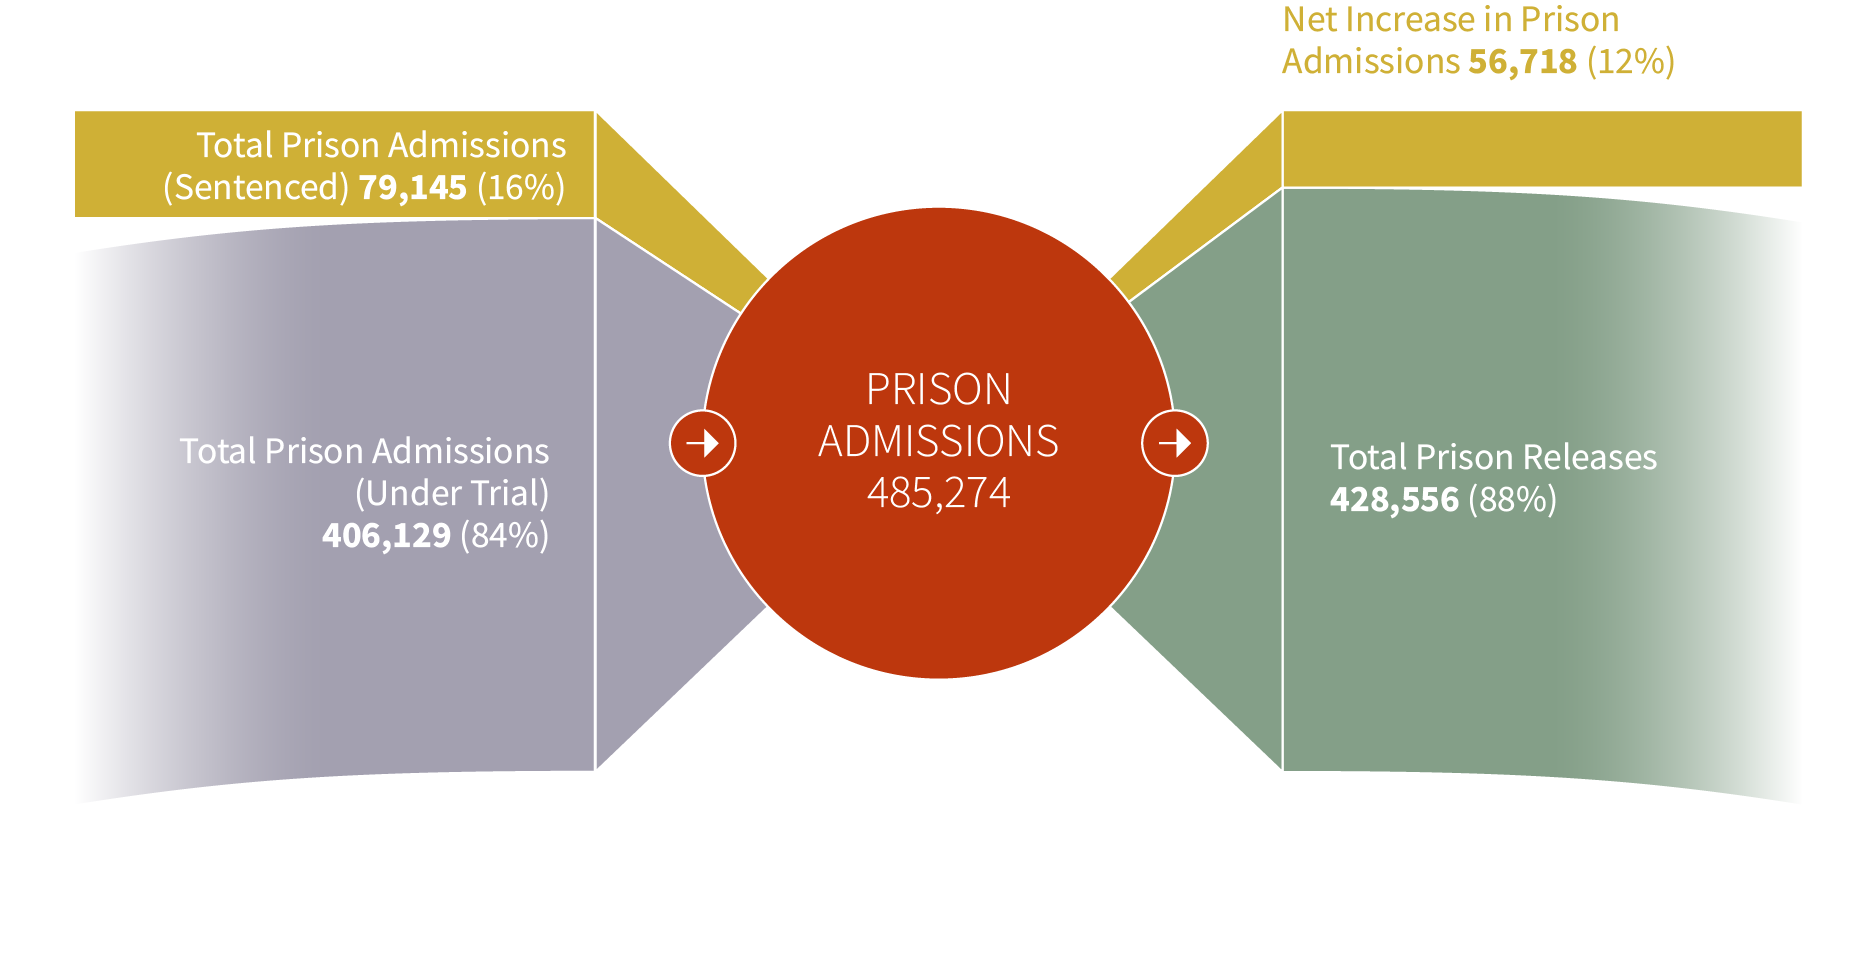
The chart below depicts the flow of cases from complaint to police and court through to sentencing and prison. The size of the circles represents relative volume of cases. Click on the circle and a popup appears with details about the volume and type of cases coming into and flowing out of that institution in 2016. In all the pop-ups, the gold colour represents the proportion of pending cases coming in from the previous year and carried forward to the next. The number in the large circle in the middle represents the total number of cases (pending and new). The next graph underneath the Case Flow provide estimated projections of the growth of pending cases in court (2018-2022). The final graphs show trends over the last five years in crime and prison populations (2011-2015).
Police investigations
Chief judicial / metro magistrate court
District metro / session courts
High court division
Appellate division
Nari O Shishu
NLASO civil+criminal
Prison admissions
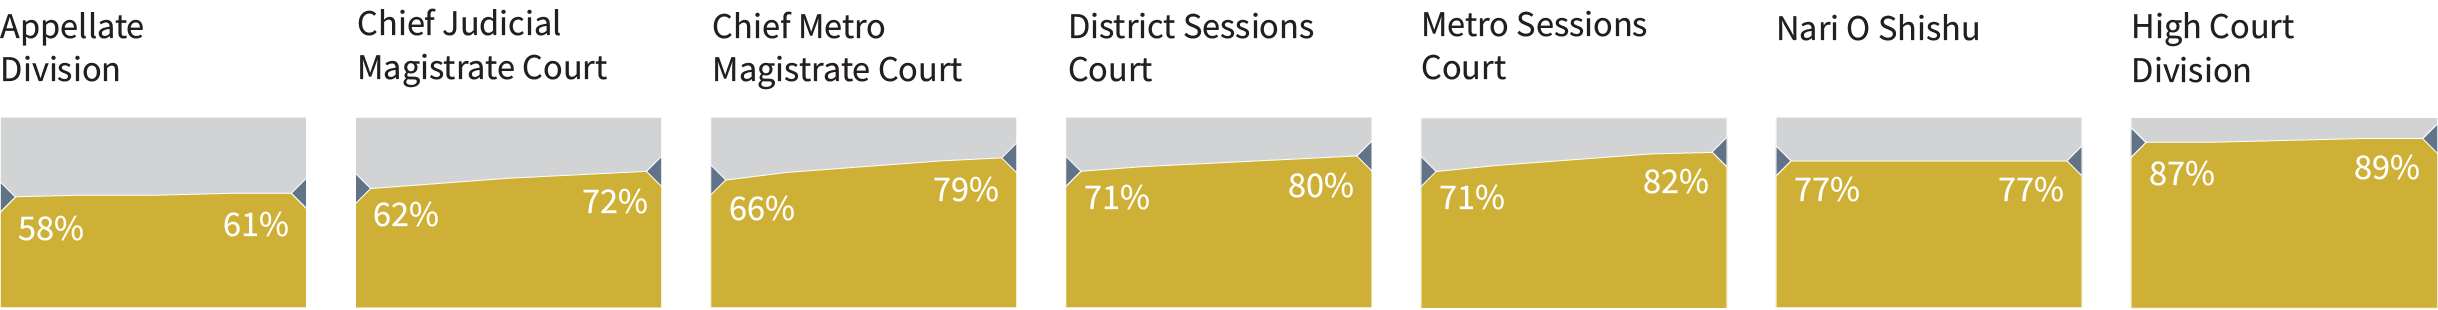
Projected pending court cases as percent of total case load, 2018-2022